
Marketing Opportunity Mapping: How to Score, Sequence, and Commit to Growth Opportunities
Marketing opportunity mapping is the process of consolidating research findings into a single ranked set of growth opportunities, scoring each one against consistent criteria, and sequencing them into an execution order the business can actually fund. It is the decision layer of a marketing intelligence system — the point at which research stops describing the market and starts determining where the next unit of budget, headcount, and attention goes.
Most organisations do not have an opportunity problem. They have an opportunity selection problem. Market research produces a list. Customer research produces another. Competitive intelligence produces a third. Search demand analysis produces a fourth. Each is individually sound, none is comparable to the others, and the eventual decision is made in a meeting by whoever argues most persuasively. Opportunity mapping exists to replace that meeting with a method.
Why Opportunity Lists Fail to Become Decisions
Research rarely fails because it is wrong. It fails because it arrives in incompatible formats.
Findings are not comparable. A keyword gap is expressed in search volume. A positioning gap is expressed in narrative. A retention gap is expressed in cohort percentages. Placed side by side, they cannot be ranked, so they are ranked by whichever is easiest to explain.
Value is estimated but cost is not. Opportunities are almost always assessed on upside and almost never on the capability, time, and organisational change required to capture them. The result is a plan full of high-value items the business is structurally unable to execute.
Everything is prioritised, so nothing is sequenced. A list of twelve “high priority” opportunities is not a priority list. Prioritisation without sequencing simply distributes the same capacity across more fronts and slows all of them.
Nobody owns the decision. An opportunity without a named owner and a review date is an observation. Observations do not consume budget, which is why they also do not produce results.
Nothing is ever removed. Opportunities accumulate across quarters. Without an explicit decline decision, the list becomes an archive rather than a plan, and the cost of maintaining it exceeds the value of consulting it.
The underlying problem: value and feasibility are assessed by different people, at different times, using different units. Opportunity mapping’s core function is to force both onto one comparable scale before anyone argues about what to do.
Where Opportunity Mapping Sits in the Marketing Intelligence System
Opportunity mapping consumes research. It does not produce it. Attempting to run it before the input subsystems have delivered produces confident rankings built on assumption.
| Input subsystem | What it contributes | What it cannot tell you |
| Market Research Framework | Market boundary, size, structure, and direction | Which segment inside that market to serve first |
| Customer Research | What buyers value, how they decide, where they stall | Whether anyone else is already serving that need |
| Competitor Analysis System | Which positions are defended and which are contestable | Whether the contestable positions are commercially worth taking |
| Search Demand Analysis | Where expressed demand exists and at what volume | Whether that demand converts into revenue |
Each subsystem answers a different question and none answers the funding question. Opportunity mapping is the mechanism that takes four incompatible outputs and produces one ordered sequence. Everything upstream is diagnosis; this is where the business commits.
⚠️ Before You Download: Audit Your Research Inputs
Opportunity mapping requires structured data from upstream subsystems. Downloading the template without these inputs will result in confident rankings built on assumptions. If you have not yet completed your research subsystems, start here first:
- Market Research Framework — Define market boundary & size
- Customer Research — Identify buyer value & friction
- Competitor Analysis System — Find contestable positions
- Search Demand Analysis — Map expressed intent
Warning Note: A reader who downloads the template without these inputs will not be able to use it effectively.
Inside the broader Marketing Scrappers (MS) Research System—our unified intelligence framework—opportunity mapping acts as the bridge between research and execution: market boundary → demand evidence → buyer evidence → competitive position → opportunity mapping → channel execution
The MS Opportunity Mapping Framework
Marketing Scrappers uses a five-stage framework. Each stage produces an artefact the next stage consumes, and the sequence is not optional — scoring before qualification is the most common cause of a technically rigorous but strategically useless output.
Stage 1 — Consolidate
Pull every research finding into a single opportunity register, restated in a common format. Each entry must be written as a claim that can be tested:
“[Specific buyer group] currently [unmet need or friction], which we could address through [intervention], producing [commercial outcome].”
If a finding cannot be written this way, it is not yet an opportunity — it is an observation awaiting interpretation. Expect roughly one third of raw research findings to fail this test on first pass.
Artefact: the opportunity register.
Stage 2 — Qualify
Apply three gates before any scoring takes place. Scoring unqualified opportunities produces precise numbers attached to bad candidates, which is worse than no numbers at all.
Gate 1 — Evidence. Is this supported by observed evidence rather than internal belief? Named sources, dated, from at least one research subsystem. Internal conviction is not evidence.
Gate 2 — Materiality. If fully captured, would this move a metric the business actually reports on? Opportunities that succeed without visibly changing anything are a real category and a common time sink.
Gate 3 — Ownership. Is there a function that could plausibly own delivery? Opportunities with no credible owner are strategy notes, not plan items.
Anything failing a gate moves to a parked list with the reason recorded. The reason matters: a parked opportunity that failed on evidence may qualify next cycle once research catches up.
Artefact: the qualified opportunity set.
Stage 3 — Score
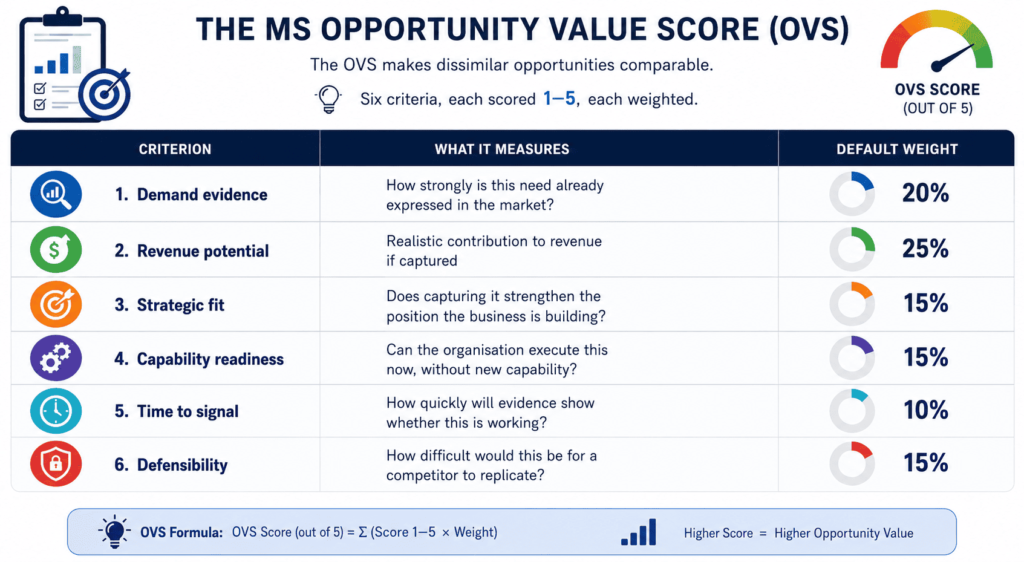
Every qualified opportunity is scored 1–5 against six criteria, weighted for the business. Weights are set once and held constant so that movement between cycles reflects the market rather than shifting criteria.
Artefact: the MS Opportunity Value Score (OVS).
Stage 4 — Sequence
Scores rank opportunities. They do not sequence them. Sequencing accounts for dependency, capacity, and time-to-signal — which is why the highest-scoring opportunity is frequently not the one to start.
Artefact: the MS Opportunity Sequencing Matrix.

Stage 5 — Commit
Each sequenced opportunity receives an owner, a hypothesis, a success measure, a review date, and a defined kill condition. Without a kill condition, an opportunity cannot fail — it can only continue.
Artefact: the committed growth plan.
The MS Opportunity Value Score (OVS)
Scoring rubric
| Criterion | 1 — Weak | 3 — Moderate | 5 — Strong |
| Demand evidence | Inferred from internal opinion | Some observed demand, unquantified | Consistently observed across two or more research subsystems |
| Revenue potential | Marginal or indirect | Meaningful contribution to a secondary metric | Material contribution to primary revenue |
| Strategic fit | Pulls attention away from core position | Neutral to current positioning | Directly reinforces the position being built |
| Capability readiness | Requires new function or skillset | Requires reallocation or partial upskilling | Executable with current team and tooling |
| Time to signal | 9+ months before evidence appears | 3–6 months | Under 90 days |
| Defensibility | Trivially copied within weeks | Requires competitor effort to match | Structurally difficult to copy, evaluated against Michael Porter’s competitive forces framework |
Calculation: OVS = Σ (criterion score × weight), producing a value between 1.00 and 5.00.
Adjusting weights to context
Default weights suit an established business with stable revenue. They should be adjusted deliberately, once, and documented:
- Early-stage or pre-product-market-fit: raise time to signal to 20% and lower defensibility to 5%. Learning speed matters more than moat-building before the model is proven.
- Constrained or cash-sensitive: raise capability readiness to 25%. Opportunities requiring new capability carry hidden cost that scoring systematically understates.
- Mature category under competitive pressure: raise defensibility to 25% and strategic fit to 20%. Winning ground you cannot hold is expensive.
Changing weights mid-cycle invalidates comparison. Change them between cycles, and note the change on the register.
The MS Opportunity Sequencing Matrix
A ranked score list still does not tell you what to start on Monday. Sequencing plots each opportunity against two axes:
- Vertical axis — Opportunity Value Score (the OVS result)
- Horizontal axis — Execution readiness (capability, dependency, and capacity combined)
| Zone | Value | Readiness | Decision |
| Execute | High | High | Start now. These fund the cycle and produce the evidence that justifies the rest of the plan. |
| Enable | High | Low | Do not start delivery. Start the capability work that moves it into Execute — hiring, tooling, data, or an upstream dependency. |
| Stage | Low | High | Hold in reserve. Cheap to execute, but running them now consumes capacity that Execute items need. Useful as filler when a primary item is blocked. |
| Decline | Low | Low | Remove from the register and record the reason. Declining explicitly is what keeps the register a plan rather than an archive. |
Two sequencing rules
Rule 1 — Sequence for evidence, not just value. Where two opportunities score similarly, start the one with the shorter time to signal. Early evidence buys the internal credibility that longer-horizon opportunities require to survive their first budget review.
Rule 2 — Fund Enable work explicitly. The most common failure in this framework is treating Enable opportunities as future items rather than current capability projects. If nothing is funded to move opportunities out of Enable, the quadrant becomes permanent, and the business spends every cycle executing its lower-value options.
Portfolio balance
A single-cycle plan drawn entirely from Execute optimises for the current quarter and starves the next four. As a working allocation:
- ~60% Execute — near-term, high-confidence capture
- ~30% Enable — capability building against high-value future positions
- ~10% exploratory — low-confidence, high-upside tests with strict kill conditions
This mirrors the logic behind McKinsey’s three-horizons model, applied at marketing-portfolio rather than corporate level. The percentages are a starting point, not a rule; the principle — that a plan must fund its own future — is the part that holds.
Opportunity Types: What Actually Goes on the Register
Registers skew heavily toward demand capture because it is the easiest type to observe. A complete map covers six.
1. Demand capture. Expressed demand the business is not currently reaching. Visible in search demand analysis and paid channel data. Highest confidence, lowest defensibility — everyone can see it.
2. Positioning. A claim the category leaves unmade that buyers repeatedly raise. Slow to score, high in defensibility, and typically the highest-leverage type once captured.
3. Conversion. Existing traffic and pipeline that fails at a specific step. Usually the fastest time-to-signal on the register and consistently underrepresented because it produces no new audience. See conversion optimization.
4. Retention and expansion. Revenue available from existing customers. Frequently excluded from marketing opportunity registers on the grounds that it is a product or CS concern — an exclusion that removes the cheapest revenue on the list.
5. Channel. A route to market the business under-uses or a competitor has left thin. Score carefully: channel opportunities have deceptively low capability readiness.
6. Authority. Topics, formats, or research positions the business could own. Long time-to-signal, high defensibility, and increasingly relevant as AI-assisted search rewards entities that are consistently cited rather than pages that are merely optimised. See content marketing.
If five of six types are absent from a register, the constraint is the research feeding it, not the market.
Worked Examples
The following are illustrative scenarios showing how scoring changes the answer. Figures are structural, not measured.
B2B SaaS
Three qualified opportunities:
| Opportunity | Type | Demand | Revenue | Fit | Readiness | Signal | Defensibility | OVS |
| Capture comparison-stage search demand | Demand capture | 5 | 4 | 3 | 4 | 4 | 2 | 3.70 |
| Reposition around an unclaimed buyer outcome | Positioning | 3 | 5 | 5 | 2 | 2 | 5 | 3.85 |
| Fix trial-to-paid activation drop | Conversion | 2 | 4 | 3 | 5 | 5 | 3 | 3.55 |
The naive read is to start with repositioning — highest OVS. Sequencing says otherwise: repositioning scores 2 on readiness, placing it in Enable. The activation fix sits in Execute with a 5 on time to signal. Correct sequence: run activation now, fund positioning research in parallel, hold comparison-demand capture until the repositioning resolves what the comparison pages should actually claim.
Ecommerce
A marketplace-dependent brand scores a “reduce marketplace dependency” opportunity at high value and low readiness. It sits in Enable. The mistake would be launching a direct channel this quarter; the correct move is funding the first-party data and retention infrastructure that makes direct viable, while continuing to run low-effort, quick-win opportunities on the marketplace (held in the Stage zone) to protect existing baseline revenue.
Professional services agency
An authority opportunity — original benchmark research nobody in the category publishes — scores 5 on defensibility and 1 on time to signal. In a business needing pipeline this quarter it is correctly sequenced second. In a business with stable pipeline building a three-year position it is correctly sequenced first. Same opportunity, same score, opposite decision. Scores rank; context sequences.
Decision Tree: Should This Opportunity Enter the Cycle?
-
Is it supported by dated, sourced research evidence?
├─ No → Park. Record as an evidence gap for the next research cycle.
└─ Yes
Would capture visibly move a reported metric?├─ No → Decline. Record the reason.
└─ Yes
Is there a function that could own delivery?├─ No → Park as an Enable candidate; identify the capability required.
└─ Yes
Score the OVS.Is execution readiness high?├─ No → ENABLE. Fund the capability, not the delivery.
└─ Yes
Is the OVS above the cycle threshold?├─ No → STAGE. Hold as reserve capacity.
└─ Yes → EXECUTE. Assign owner, hypothesis, measure, review date, and kill condition.
Set the cycle threshold once, based on capacity rather than ambition: if a team can run four opportunities per quarter, the threshold is whatever score the fourth-ranked Execute item carries.
Implementation Checklist
Consolidate
Qualify
Score
Sequence
Commit
Common Mistakes
Scoring before qualifying. Precision applied to unqualified candidates produces defensible-looking rankings of the wrong things. Gates first, always.
Treating the score as the decision. The OVS ranks. Sequencing decides. A business that executes strictly in score order will consistently start work it is not ready to deliver.
Ignoring capability cost. Value is estimated enthusiastically; cost to capture is estimated optimistically or not at all. This single asymmetry explains most over-committed marketing plans.
Never declining anything. A register that only grows is an archive. If nothing was declined this cycle, the qualification gates were not applied.
Re-weighting to justify a preferred answer. If weights move whenever a favoured opportunity ranks poorly, the framework has become a rationalisation tool. Weights are set between cycles, with the change documented.
Mapping once. Opportunity mapping is a quarterly cycle, not an annual exercise. The market changes, capability changes, and Enable items graduate to Execute. A map that is never re-run describes a business that no longer exists.
Confusing opportunity mapping with strategy. This framework decides sequence within a strategy. It does not choose the strategy. If the underlying positioning is wrong, faster execution of a well-sequenced plan simply arrives at the wrong destination sooner.
Limitations Worth Stating Plainly
Any scoring framework converts judgement into numbers, and numbers look more certain than the judgement underneath them. Three specific limitations apply:
Scores are estimates. Revenue potential and defensibility in particular are informed opinion. Two competent analysts will differ by a point. This is why scoring should be done independently and reconciled, and why one-point differences in OVS should not drive decisions.
The framework rewards the observable. Opportunities supported by clean data score better than opportunities that are real but harder to evidence. The exploratory 10% allocation exists specifically to protect against this bias.
It assumes the strategy is sound. Opportunity mapping optimises allocation within a chosen direction. It has no mechanism for detecting that the direction itself is wrong.
Stating these limitations is not a hedge. A framework whose failure modes are known is more useful than one presented as complete.
Cadence and Governance
| Activity | Frequency | Owner |
| Full mapping cycle (all five stages) | Quarterly | Marketing or growth lead |
| Register review — new findings added | Monthly | Research owner |
| Committed opportunity review against kill conditions | Monthly | Opportunity owners |
| Weight review | Annually, or on material change in business stage | Executive sponsor |
Two governance rules make the difference between a framework that survives and one that is abandoned after two cycles. First, kill conditions must be enforced — an opportunity that misses its condition is stopped or explicitly re-committed with a documented reason. Second, the register is a shared artefact, not a document owned by one analyst; opportunities that only one person can interpret do not survive that person’s next quarter.
Summary
- Marketing opportunity mapping consolidates research into one ranked, sequenced, and committed set of growth opportunities.
- Research produces incomparable findings; mapping exists to make them comparable before decisions are made.
- The MS Opportunity Mapping Framework runs Consolidate → Qualify → Score → Sequence → Commit.
- The MS Opportunity Value Score (OVS) scores six weighted criteria: demand evidence, revenue potential, strategic fit, capability readiness, time to signal, and defensibility.
- The MS Opportunity Sequencing Matrix converts scores into action across four zones: Execute, Enable, Stage, and Decline.
- Scores rank; context sequences. The highest-scoring opportunity is frequently not the one to start.
- Kill conditions and explicit declines are what keep the register a plan rather than an archive.
Next Steps
If you are running this for the first time, do not begin by scoring. Begin by auditing whether the four upstream subsystems have delivered — market research, customer research, competitive intelligence, and search demand analysis. Mapping built on one input reproduces that input’s blind spots at higher confidence.
Once the register is qualified and sequenced, execution moves into channel systems: SEO for demand capture and authority opportunities, content marketing for positioning and authority, and conversion optimization for pipeline efficiency opportunities.
Qualified Register, but Contested Sequencing?
If your opportunity register is qualified but team alignment is stalling—or if high-value “Enable” initiatives have sat untouched across multiple execution cycles—let’s unblock it together.
This is a hands-on working session, not a sales call. We will review your current OVS scoring, resolve internal friction, and establish a clear execution sequence.
FAQ
What is marketing opportunity mapping?
Marketing opportunity mapping is the process of consolidating research findings into a single register of growth opportunities, scoring each against consistent weighted criteria, and sequencing them into a funded execution order. It converts research into allocation decisions.
How is opportunity mapping different from a SWOT analysis?
SWOT is a summary format with no scoring rubric, no comparability between cycles, and no sequencing output. Opportunity mapping produces a ranked, weighted, owned, and time-bound plan. SWOT can communicate a conclusion; it cannot reach one.
How is it different from competitor analysis?
Competitive intelligence describes the supply side of a market — who is present and how strongly positioned. Opportunity mapping consumes that output alongside demand, customer, and market inputs, and decides which of the resulting opportunities to fund first.
How many opportunities should be on the register?
The qualified register typically holds 15–30 entries. The committed plan should hold no more than the team can genuinely run — for most marketing teams, three to five per quarter. A committed list longer than capacity is a capacity problem disguised as a plan.
How often should opportunity mapping be re-run?
A full cycle quarterly, with a monthly register review to add new findings and check committed opportunities against their kill conditions. Annual mapping is too slow for most digital categories.
Who should own the opportunity map?
The marketing or growth lead owns the map. Individual opportunities are owned by whichever function delivers them. Distributed scoring with a single owner of the register is more reliable than either full centralisation or full delegation.
Can opportunity mapping work without formal research?
Partially, and with a clear cost. Without evidence, the qualification gate collapses and scoring reflects internal belief. If research capacity is limited, run mapping on a smaller set of well-evidenced opportunities rather than a large set of assumed ones.
Does opportunity mapping apply to AI search visibility?
Yes — AI search visibility typically enters the register as an authority opportunity: long time-to-signal, high defensibility, dependent on consistent citation rather than page-level optimisation. It scores poorly on speed and well on durability, which usually places it in Enable for businesses without existing authority infrastructure.
What if two opportunities score identically?
Sequence the one with the shorter time to signal. Early evidence protects the rest of the plan through its first budget review.