SEO Forecasting & Measurement: How to Predict and Measure Organic Growth (2026)
By the Marketing Scrappers SEO Strategy Team — reviewed August 2026
SEO forecasting and measurement is the discipline of estimating future organic search performance from historical data, search demand, and ranking assumptions, then validating that estimate against real KPIs — search visibility, traffic, conversions, and revenue — instead of relying on rankings alone. Done properly, it turns SEO from a line-item expense into a plannable revenue channel. Done the way most companies do it — tracking keyword positions and hoping traffic follows — it turns SEO into the first budget line cut when a CFO asks for proof of return.
This guide is built for the second group: business owners, marketing leaders, and SEO teams who need to defend a budget, set realistic expectations, or simply stop guessing whether last quarter’s SEO work is actually working. It walks through the MS SEO Forecasting Framework™, the KPIs that matter at each stage, how to build a measurement system instead of a report, and what changes when a large share of the SERP is now an AI-generated answer rather than a list of links.
What SEO Forecasting & Measurement Actually Means
SEO forecasting is the process of projecting future organic performance — impressions, clicks, conversions, or revenue — using search demand data, click-through rate (CTR) modeling, and assumptions about ranking movement over a defined time horizon.
SEO measurement is the ongoing practice of tracking actual performance against that forecast, using defined KPIs at every stage of the funnel, so the business can see whether the strategy is working before the annual results come in.
The two are inseparable. A forecast without measurement is a guess nobody checks. Measurement without a forecast is a dashboard nobody can interpret — you can see that traffic went up 12%, but not whether 12% was the plan, a disappointment, or a fluke.
Most companies do neither well. They report on rankings, sometimes on traffic, and rarely on revenue — which is why when clients work with our SEO services, we focus on connecting organic search directly to business outcomes rather than vanity metrics.
Why This Matters More Than It Used To
Three shifts in 2026 make forecasting and measurement harder to skip than they were even two years ago.
First, click economics have changed. AI Overviews now appear on close to half of all Google searches, up sharply from a year earlier, and that share keeps climbing. On queries where an AI Overview appears, click-through rates on the traditional top organic result routinely fall well below their historical benchmarks —a SISTRIX analysis of more than 100 million German keywords, for instance, found position-1 CTR dropping from roughly 27% without an AI Overview to around 11% with one present. Other studies, across different markets and methodologies (such as Seer Interactive research on AI Overview citations and CTR), show the relative decline anywhere from the mid-30s to over 60%.
The exact number varies by study and query type; the direction does not. Any forecast still built on “position 1 gets 30-40% of clicks” is already wrong before you finish the sentence.
Second, Google itself now separates AI visibility from classic visibility. In June 2026, Google Search Console added a dedicated Generative AI performance report, showing impressions inside AI Overviews, AI Mode, and AI-powered Discover separately from the standard Performance report. It’s a genuinely useful addition — for the first time, you can see whether your pages are appearing inside AI answers at all. But it currently reports impressions only; there’s no click, CTR, or query-level breakdown yet. That means you can now measure AI visibility, but not yet AI-driven traffic value directly. Forecasting has to account for a growing category of “impact you can prove exists but can’t yet fully quantify.”
Third, budget scrutiny on marketing spend has only increased. When a business owner asks “what will this SEO investment return, and how will we know,” a vague answer ends the conversation. A structured forecast — with stated assumptions, a plausible range, and a measurement plan to validate it — is what keeps that conversation going.
The Core Entities: What You’re Actually Measuring
Before building anything, it’s worth being precise about the terms, because most SEO reporting failures start with vague language.
| Term | What It Means |
| Search Demand | The total volume of search activity around a topic or keyword set — the size of the opportunity, independent of whether you can currently capture it. |
| Search Visibility | How often and how prominently your pages appear across search results and AI-generated answers, measured through impressions, average position, and AI Overview/AI Mode appearances. |
| Click-Through Rate (CTR) | The percentage of people who see your result (an impression) and click it. CTR varies by position, query intent, device, and — increasingly — by whether an AI Overview is present. |
| Organic Traffic Forecasting | Projecting future organic sessions or clicks using search demand, CTR assumptions, and ranking trajectory. |
| Conversion Tracking | Recording the specific actions organic visitors take that indicate business value — form submissions, calls, bookings, demo requests, purchases. |
| KPI Dashboard | A defined, recurring view of the specific metrics that indicate whether SEO is progressing toward a business outcome, structured by funnel stage rather than as an undifferentiated metrics dump. |
| Revenue Attribution | Connecting organic search activity to actual revenue, either through last-click models in GA4, multi-touch models, or CRM-level pipeline tracking. |
| AI Search Visibility | A newer, distinct entity: whether your brand or content is cited, mentioned, or drawn upon inside AI Overviews, AI Mode, and third-party answer engines such as ChatGPT, Gemini, and Perplexity — separate from classic blue-link ranking. |
| SEO ROI | The financial return generated by SEO activity relative to what was spent, calculated at the point where enough of the chain above — demand, visibility, traffic, conversion, revenue — is measured to make the calculation meaningful rather than aspirational. |
Each of these is a link in the same chain. Forecasting is the practice of estimating how a change moves through that chain before it happens. Measurement is confirming whether it actually did.
The MS SEO Forecasting Framework™
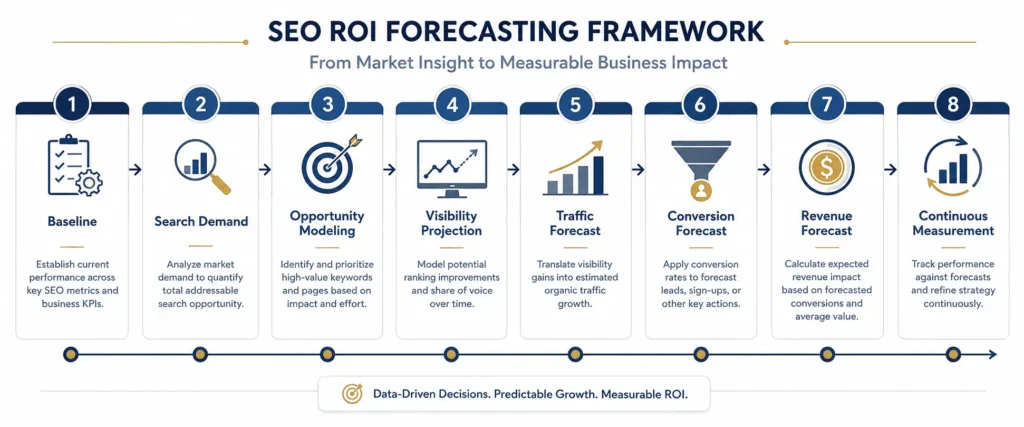
Most SEO forecasting advice stops at “search volume times CTR.” That’s the mechanic, not the method. The MS SEO Forecasting Framework™ treats forecasting as eight connected stages, each producing an input the next stage depends on. Skipping a stage doesn’t just weaken the forecast — it breaks the chain that connects SEO activity to a number a business owner can act on.
Baseline → Search Demand → Opportunity Modeling → Visibility Projection → Traffic Forecast → Conversion Forecast → Revenue Forecast → Continuous Measurement
1. Baseline
Before projecting anything forward, capture where you actually stand today — with dates attached. At minimum: current organic impressions, clicks, and average position from Google Search Console; current organic sessions and conversion events from GA4; current indexed page count; current AI Overview/AI Mode impressions where available.
This step gets skipped constantly, and it’s the single most damaging omission in SEO measurement. Without a dated baseline, there is no “before,” which means there is no way to later prove an “after.” Every forecast and every future report depends on this number existing and being screenshotted or logged, not just glanced at.
2. Search Demand
Establish the total addressable search volume for your topic or keyword set — not just the keywords you currently rank for. Use Google Search Console’s impression data (what you’re already partially capturing), a keyword research tool for volume estimates on terms you don’t yet rank for, and search trend data to understand whether demand is growing, flat, or seasonal.
Distinguish total demand from SEO-addressable demand. A meaningful share of searches in 2026 resolve entirely inside an AI Overview or AI Mode answer with no click to any website — a portion of demand exists but isn’t reachable through organic clicks no matter how well you rank. A credible forecast accounts for this rather than treating every search as a potential visit.
3. Opportunity Modeling
Overlay demand against reality: where you rank now, where competitors rank, how strong your current content and technical foundation are, and how long it realistically takes to move a page from its current position to a target position given your domain’s authority and publishing capacity.
This is where forecasts most often go wrong — not in the math, but in the assumption. Projecting a jump to position 1 within three months for a competitive, non-branded term with no existing content or backlink profile isn’t a forecast; it’s a wish with a spreadsheet attached. Model realistic movement in bands (e.g., “position 15-25 → position 6-10 within two quarters”) rather than committing to a single target position.
4. Visibility Projection
Convert the opportunity model into a visibility trajectory over time — projected impressions and average position by month or quarter, based on the specific work planned (content publication, technical fixes, internal linking, entity/schema work, link acquisition).
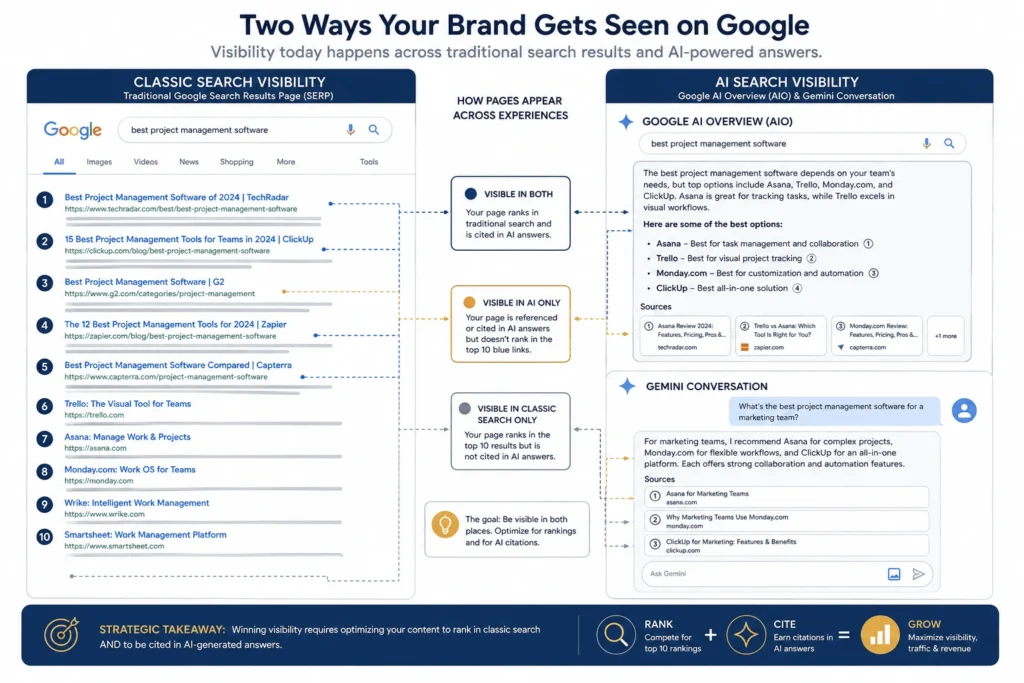
In 2026, visibility has two layers that need to be projected separately: classic ranking visibility (where you sit in traditional results) and AI visibility (whether you’re being surfaced or cited inside AI Overviews, AI Mode, and third-party answer engines). A page can gain classic ranking visibility while AI visibility stays flat, or vice versa — they don’t move in lockstep, and conflating them produces a forecast that’s right on average and wrong on the metric that actually matters to the business.
5. Traffic Forecast
This is the step most guides mean when they say “SEO forecasting”: convert projected visibility into projected clicks.
The base formula:
Estimated Monthly Traffic = Σ (Keyword Search Volume × Position-Based CTR)
The part almost every generic template gets wrong in 2026 is treating CTR as a fixed curve by position. It isn’t anymore. The CTR you should apply depends on whether the query currently triggers an AI Overview:
- No AI Overview present: position-1 CTR is still commonly in the 28–35% range on a clean SERP.
- AI Overview present: position-1 CTR frequently falls to roughly 10–15%, sometimes lower, based on multiple independent studies through early-to-mid 2026.
Pull your own historical CTR from Search Console wherever you have it — first-party data beats generic benchmarks every time. Where you don’t have history (new pages, new keyword targets), use conservative industry benchmarks rather than optimistic ones. A widely used convention is to apply roughly 50–70% of the theoretical maximum CTR for a given position, which builds in a margin for the reality that not every ranking assumption plays out exactly as modeled.
6. Conversion Forecast
Traffic that doesn’t convert is a vanity metric with better production values. Apply your actual conversion rate — segmented by intent (see our search intent SERP matching guide for details), not averaged across the whole site — to the traffic forecast.
Estimated Conversions = Estimated Traffic × Segment Conversion Rate
Segmentation matters because intent-driven behavior differs sharply. Commercial-investigation and transactional queries (e.g., “SEO agency for hospitality brands,” “book a stay”) convert at meaningfully higher rates than informational queries (e.g., “what is SEO forecasting”), and they’ve also proven more resistant to the AI Overview click decline — transactional intent generally survives an AI answer better than pure information-seeking does, because completing a booking or purchase still requires visiting a website. A single blended conversion rate applied to all forecasted traffic will overstate results from informational content and understate results from commercial pages.
7. Revenue Forecast
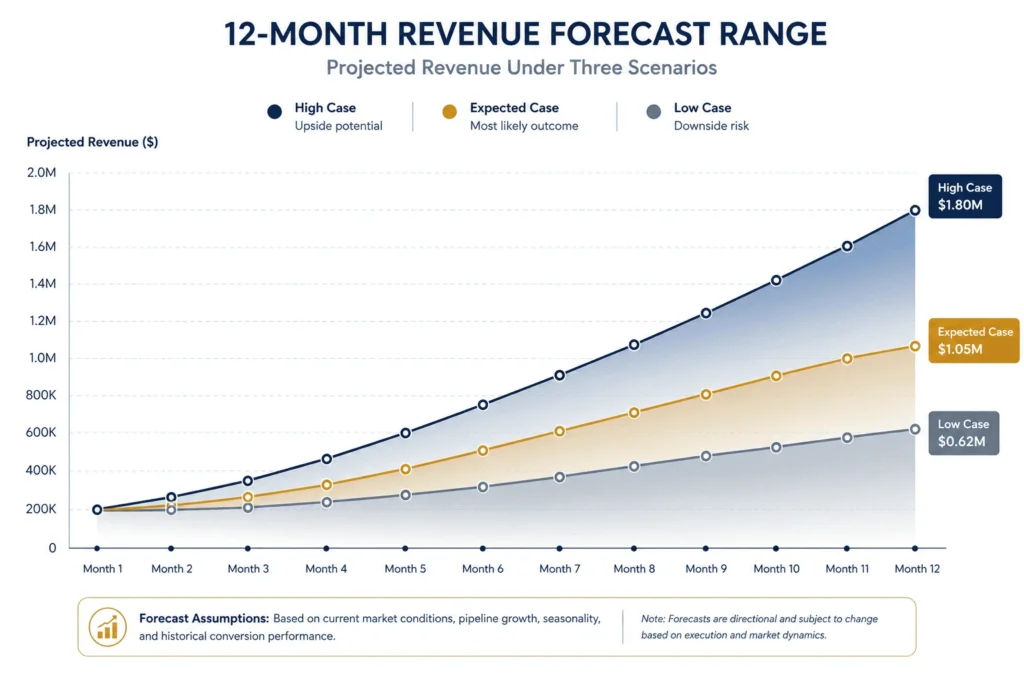
Convert conversions into a number a CFO reads without translation.
Estimated Revenue = Estimated Conversions × Average Deal Value (or AOV) × Close Rate (if lead-based)
Present this as a range, not a single figure — a low, expected, and high case — and state the assumptions behind each explicitly (source of the search volume data, the CTR benchmark used, the conversion rate applied, and the close rate if the business is lead-based rather than transactional). A range with visible assumptions builds more trust than a confident single number, because it signals the forecaster understands where the uncertainty actually lives.
8. Continuous Measurement
A forecast produced once and never revisited becomes fiction within a quarter. Build a recurring cadence — monthly is typical — that compares actual performance at every stage above against the forecast, flags where the variance is largest, and asks why before assuming the whole model is broken.
A forecast that missed on traffic but hit on conversion rate tells a different story than one that hit on traffic but missed on revenue. The variance itself is diagnostic information, not just an error to apologize for.
A Worked Example
The following is an illustrative example to show the mechanics — not a real client result.
A mid-market B2B services company wants to forecast the impact of a content and technical SEO push targeting a cluster of 40 commercial-investigation keywords with a combined monthly search volume of 22,000.
- Baseline: Currently ranking positions 15–40 across the cluster; ~180 organic clicks/month from these terms today.
- Opportunity Modeling: Realistic 6-month target is positions 6–12 across the cluster (not position 1 — the domain doesn’t have the authority yet).
- Visibility Projection: Blended average position moves from ~24 to ~9 over two quarters.
- Traffic Forecast: At position ~9, blended CTR (adjusted downward for the ~35% of these queries currently showing an AI Overview) is estimated at roughly 3–4%. 22,000 × 3.5% ≈ 770 estimated monthly clicks — up from a 180 baseline. Applying a conservative 60% confidence factor brings the working number to roughly 460–620 clicks/month by month six.
- Conversion Forecast: This cluster’s historical commercial-investigation conversion rate is 2.8%. 540 (midpoint) × 2.8% ≈ 15 conversions/month.
- Revenue Forecast: At an average deal value of $3,200 and a 25% close rate, that’s roughly 15 × 25% × $3,200 ≈ $12,000/month in projected pipeline revenue by month six — presented to the client as a $9,000–$15,000/month range, with every assumption above stated in the report.
Notice what this example deliberately does not do: it doesn’t promise position 1, it doesn’t use a flat historical CTR curve, it doesn’t skip the AI Overview adjustment, and it doesn’t hand over a single confident number with no range.
The KPI Matrix: What to Track at Each Stage
Tracking every available metric produces a report nobody reads. Tracking the right metric at the right funnel stage produces a dashboard people actually use to make decisions.
| Funnel Stage | Leading Indicators | Lagging Indicators | Primary Source | Review Cadence |
| Visibility | Impressions, average position, indexed page count, AI Overview/AI Mode impressions | — | Google Search Console (incl. Generative AI report) | Weekly |
| Engagement | CTR by query cluster, AI citation appearances | — | Google Search Console | Weekly |
| Traffic | — | Organic sessions, organic users, engaged sessions | GA4 | Weekly / Monthly |
| Conversion | Assisted conversions, micro-conversions (scroll depth, time on page for high-intent pages) | Form fills, calls, bookings, demo requests | GA4 + CRM | Monthly |
| Revenue | Pipeline created from organic sources | Closed-won revenue, CAC from organic, SEO ROI | CRM + GA4 | Monthly / Quarterly |
Leading indicators tell you the strategy is moving in the right direction before the business result shows up. Lagging indicators tell you whether it actually mattered. Reporting only lagging indicators to a client or a boss means the first sign of a problem arrives too late to fix it inside the same quarter.
Building a Measurement Dashboard, Not a Report
A report is a snapshot someone reads once. A dashboard is a system someone checks on a schedule and acts on. The difference matters more than the tooling.
A workable SEO measurement dashboard needs three things, regardless of which tools generate it:
- A tier structure, not a flat metric list — separate views for leading indicators (checked weekly, 15–20 minutes), visibility/traffic trends (checked monthly), and revenue-tier metrics (checked monthly or quarterly, tied to business planning cycles).
- A forecast-vs-actual view, not just an actuals view. Every metric that was forecast should sit next to what actually happened, with variance visible at a glance — this is what turns a dashboard into a learning system instead of a scoreboard.
- A defined owner and cadence for each tier. A dashboard nobody is assigned to review on a schedule degrades into a tool that gets opened only when someone asks an uncomfortable question.
The base toolkit for most mid-market SEO measurement in 2026 doesn’t require an enterprise platform: Google Search Console (including the Generative AI performance report for AI visibility), GA4 for traffic and conversion behavior, a CRM or spreadsheet-based pipeline log for revenue attribution, and a rank tracker for position monitoring at the keyword-cluster level. Paid AI-visibility platforms exist and can add value at scale, but a manually maintained prompt-tracking log — checking how a defined set of buyer-intent queries perform across ChatGPT, Perplexity, Gemini, and Google AI Mode on a fixed schedule — captures most of the same signal before that spend is justified by client or revenue volume.
Forecasting in the Age of AI Search
Three practical adjustments matter right now, and most SEO forecasting templates still in circulation haven’t caught up to any of them.
Split “visibility” into two metrics, not one. Classic ranking position and AI Overview/AI Mode citation are different phenomena that respond to different inputs — technical crawlability and structured data matter more for the latter; backlink authority and on-page optimization matter more for the former. A forecast that reports one “visibility” number is quietly averaging together two things that move independently.
Weight query-level CTR assumptions by AI Overview prevalence, not by position alone. Two keywords at the same rank position can have wildly different realistic CTR if one triggers an AI Overview and the other doesn’t. Pull or estimate which of your target queries currently show an AI Overview before applying a blanket CTR curve to the whole cluster.
Treat “cited inside an AI Overview” as a measurable outcome with real upside, not just a defensive concern. Industry research through 2026 has consistently found that pages cited inside an AI Overview capture meaningfully more of the remaining click volume than an uncited top organic result on the same query — a Seer Interactive analysis put the gap at roughly 35% more organic clicks for cited pages. Being the cited source inside the answer is increasingly the higher-value target than being blue-link position 1 on the same query.
Common Mistakes in SEO Forecasting & Measurement
- Forecasting rankings instead of business outcomes. A “we’ll rank on page 1” forecast tells an executive nothing about revenue. Every forecast should terminate in a business metric.
- Applying a flat, decade-old CTR curve. Position 1 does not mean what it meant five years ago. Adjust for AI Overview presence at the query level.
- Skipping the baseline. Without a dated “before,” no result can ever be proven as an “after” — not to a client, not to a boss, not to yourself six months later.
- Presenting a single number instead of a range. A confident point estimate looks more credible for about a month, until it’s wrong, and then it looks like a broken promise. A stated range with visible assumptions survives scrutiny.
- Using one blended conversion rate across every intent type. This inflates the apparent value of informational traffic and understates the value of commercial pages.
- Building the forecast once and never revisiting it. Algorithm updates, seasonality, and competitive shifts make a static forecast stale within a quarter.
- Attributing revenue on last-click alone without disclosing the model. Not disclosing the attribution model used isn’t dishonest by intent, usually — but it produces numbers that don’t survive a second look from a CFO who asks how they were calculated.
- Double-counting overlapping keywords that would realistically be served by the same ranking page, inflating the total addressable traffic figure.
Best Practices for Credible SEO Forecasts
- State assumptions in writing, next to the number. Search volume source, CTR benchmark used, conversion rate applied, and attribution model — all visible, not buried in a footnote.
- Forecast in ranges, report in ranges. A well-built 12-month organic forecast built on first-party data is commonly directionally accurate within roughly 20–30% — useful for planning, not useful as a guarantee. Say so.
- Separate leading and lagging KPIs in every report, so a stakeholder can see momentum before the lagging number confirms or denies it.
- Re-forecast on a fixed schedule — quarterly is typical — rather than only when someone asks whether the plan is working.
- Segment everything by intent, not just by keyword or page. Informational, commercial-investigation, and transactional traffic behave differently at every stage of this framework.
- Decide how much to trust a forecast based on the data behind it, not the confidence of the person presenting it:
- Established site, 12+ months of first-party GSC/GA4 history, stable competitive set → narrower range, higher confidence, quarterly re-forecast is usually sufficient.
- New site or new topic area, little first-party history, volatile SERP (heavy AI Overview presence, frequent core updates in the space) → wider range, lower confidence, monthly re-forecast, and say explicitly that early months are for calibrating assumptions rather than validating them.
Turn SEO Predictions Into Measurable Revenue
Take action on your SEO forecasting strategy with our free resource or personalized expert review.
SEO Forecasting Template
Download our pre-built spreadsheet model to project organic traffic, CTR, and conversion ranges with ease.
Download Free TemplateBook an SEO Strategy Audit
Get a comprehensive review of your search visibility, AI Overview exposure, and revenue growth trajectory.
Book Strategy AuditFrequently Asked Questions
What is SEO forecasting and why does it matter for business planning? SEO forecasting is the practice of projecting future organic traffic, conversions, or revenue using search demand data, CTR modeling, and ranking assumptions. It matters because it lets a business plan budget and set expectations for SEO the same way it would for any other investment — with a stated return estimate rather than an open-ended promise.
How accurate can an SEO forecast realistically be? A well-built forecast using first-party data and conservative, disclosed assumptions is commonly directionally accurate within roughly 20–30% over a 12-month horizon. Accuracy degrades further out and on newer sites with limited historical data, which is why forecasts should always be presented as ranges and revisited on a fixed schedule rather than treated as fixed targets.
What KPIs should I track for SEO performance measurement? Track different KPIs at different funnel stages: visibility metrics (impressions, average position, AI Overview/AI Mode impressions) as leading indicators; traffic and engagement metrics in the middle; and conversion and revenue metrics as the outcomes that ultimately justify the investment. A single blended metric across all of these hides more than it reveals.
How do AI Overviews and AI Mode affect SEO traffic forecasts? They reduce the click-through rate available at any given ranking position on queries where they appear — commonly by half or more compared to a clean SERP, based on multiple 2026 studies — and they add a second, distinct visibility layer (AI citation) that doesn’t move in lockstep with classic rankings. Forecasts that don’t adjust CTR assumptions for AI Overview presence, and that don’t track AI visibility separately from ranking visibility, will consistently overstate expected traffic.
What’s the difference between SEO measurement and SEO reporting? Measurement is the ongoing system of tracking defined KPIs against a forecast on a set cadence. Reporting is the communication artifact — the document or dashboard view — that presents what measurement found to a stakeholder. Good measurement can survive bad reporting; good reporting can’t compensate for measurement that was never properly set up.
How often should an SEO forecast be updated? Quarterly is a reasonable default for an established site with stable search behavior in its category. Monthly re-forecasting is more appropriate for new sites, new topic areas, or categories experiencing heavy AI Overview disruption or frequent algorithm updates, where assumptions need to be recalibrated faster.
Can Google Search Console alone measure SEO ROI? No. Search Console measures visibility and click behavior — impressions, clicks, average position, and now AI Overview/AI Mode impressions — but it doesn’t track conversions or revenue. A complete measurement system connects Search Console data to GA4 for on-site behavior and conversion events, and to a CRM or pipeline log for revenue attribution. ROI sits at the end of that chain, not inside any single tool.
Summary and Next Step
SEO forecasting and measurement isn’t a reporting formality — it’s the mechanism that lets a business decide, with evidence, whether to keep funding a channel. The MS SEO Forecasting Framework™ — Baseline → Search Demand → Opportunity Modeling → Visibility Projection → Traffic Forecast → Conversion Forecast → Revenue Forecast → Continuous Measurement — exists to make that decision defensible: every number traces back to a stated assumption, and every forecast gets checked against what actually happened.
If your current SEO reporting stops at rankings and traffic, the gap between that and a revenue-connected forecast is usually the biggest single credibility problem in an SEO program — and it’s fixable without new tooling, just a clearer method.
To see where your own search demand, visibility, and conversion data currently stand against a structured forecast, book a SEO Strategy Audit with Marketing Scrappers. If you’d rather start by building the model yourself, download the SEO Forecasting Template built on the framework above.