Why Standard Analytics Can’t Answer This Question
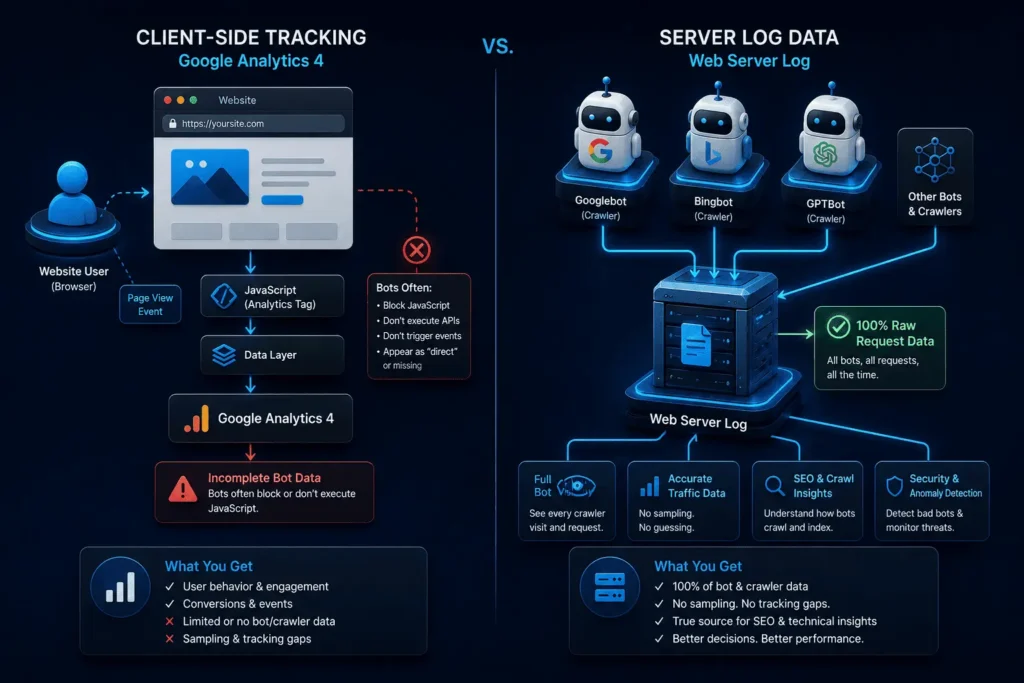
Most technical SEO diagnosis stops at Google Search Console and Google Analytics 4. Both are useful, and neither was built to show you crawler behavior in full.
GA4 fires from client-side JavaScript. Googlebot, Bingbot, GPTBot, and most other crawlers don’t execute your analytics tags the way a browser does, so a huge share of crawl activity is invisible to GA4 by design. As noted in the Google Search Console Crawl Stats documentation, Search Console provides an aggregated summary of Google’s own behavior—grouping requests into response codes, file types, and purposes—but it doesn’t cover Bingbot, GPTBot, ClaudeBot, or PerplexityBot, or any other non-Google crawler.
Your server logs don’t have this limitation. Every HTTP request that reached your web server — whether it came from a human, Googlebot, a scraper, or a spoofed bot pretending to be Googlebot — leaves a line in the log. That’s the core pain most technical SEOs and enterprise site owners run into: they can see rankings move, they can see indexation lag, but they can’t see the actual crawl behavior driving those outcomes, because the tools they’re using were never designed to show it.
Log file analysis closes that gap. It turns “we think Google isn’t crawling our new pages fast enough” into a data-backed answer: here are the 40,000 requests Googlebot made last month, here’s where it spent its time, and here’s what’s stopping it from reaching the pages that matter.
This guide focuses exclusively on that diagnostic discipline — collecting, verifying, and interpreting log data. For the separate question of how much crawl capacity your site is allocated and how to expand it, see the Crawl Budget Guide; for the implementation work that follows a log audit, see Technical SEO services.
For technical SEO professionals and enterprise site owners, this matters commercially, not just academically. Delayed indexing means a product launch, a price change, or a new location page sits invisible to search for weeks longer than it should. Crawl waste on low-value URL patterns means the crawl capacity your best content actually needs gets spent elsewhere. And in 2026, with a growing share of buyer research happening through AI answer engines rather than ten blue links, the same log data that diagnoses Googlebot problems is often the only evidence you have that GPTBot, ClaudeBot, or PerplexityBot ever reached your site at all. Log file analysis is how you move technical SEO decisions from “this seems like it should help” to “here is the exact behavior we changed, and here is the exact behavior that resulted.”
Anatomy of a Server Log Line
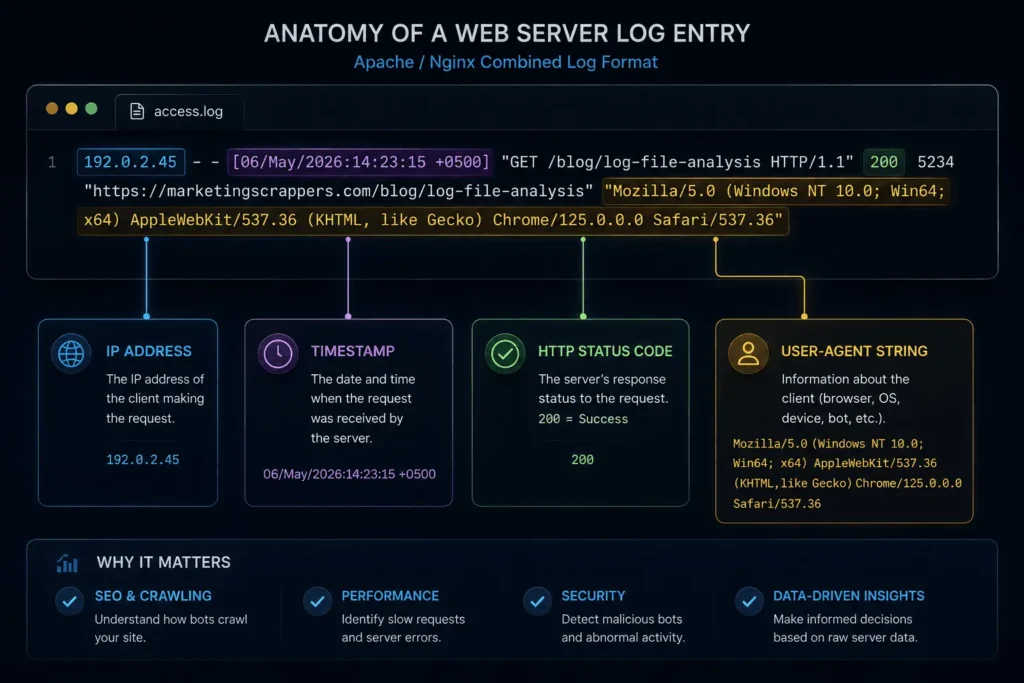
Before you can analyze anything, you need to know what you’re looking at. If you need a refresher on technical HTTP headers or log fields, refer to our SEO Glossary:
66.249.66.1 – – [03/Aug/2026:04:12:07 +0500] “GET /blog/log-file-analysis/ HTTP/1.1” 200 18432 “-” “Mozilla/5.0 (compatible; Googlebot/2.1; +http://www.google.com/bot.html)” 0.184
Reading it left to right:
Key Parameters: IP, Timestamp, Status Code, User-Agent
- IP address (66.249.66.1) — where the request came from. This is the field you’ll use to verify the crawler is genuine.
- Timestamp — when the request hit your server, in your server’s configured timezone.
- Request line (GET /blog/… HTTP/1.1) — the method and the exact URL requested.
- Status code (200) — what your server returned. This is the single most important field for crawl-waste analysis.
- Bytes sent (18432) — response size, useful for spotting bloated pages crawlers are spending disproportionate time on.
- Referrer — usually empty (-) for crawler requests.
- User-agent string — what the requester claims to be. Treat this as a claim, not a fact, for reasons covered in the next section.
- Response time (0.184 seconds) — not present in every log format, but critical when it is, because it’s your earliest warning sign of crawl-rate throttling.
Three practical notes worth knowing before you request logs from a developer or hosting provider:
- Format varies by stack. Nginx, Apache, IIS, and CDN/WAF layers (Cloudflare, Akamai, Fastly) each log slightly different fields by default, and CDN logs often replace the origin server’s view entirely if requests are served from cache. Confirm which layer is logging what before drawing conclusions.
- Retention windows are usually short. Many hosting setups rotate and delete logs after 7–14 days by default. If you want month-over-month crawl trend data, this needs to be changed before you need the history, not after.
- Getting access usually requires a developer. This is one of the few genuinely technical bottlenecks in SEO — log files typically live outside anything a marketing team can reach without server or hosting-panel access. Plan the request early in any audit timeline.
Verifying Crawlers Are Real (Filtering Fake Googlebots)
User-agent strings are trivially easy to fake. Anyone can send a request with Googlebot/2.1 in the header — spam bots, scrapers, and competitor tools do this constantly. If your analysis trusts the user-agent field alone, you’re not analyzing Googlebot’s behavior; you’re analyzing whoever claimed to be Googlebot, which is a materially different (and often much larger) dataset.
Google’s own guidance is explicit on this: verify identity through DNS, not through the user-agent header. To ensure rogue scrapers or fake bots aren’t impersonating search engines, cross-check IP addresses against the official Google Search Central guide on verifying crawlers. The process is a two-step, bidirectional check:
- Reverse DNS lookup on the requesting IP. A genuine Googlebot IP resolves to a hostname ending in googlebot.com, google.com, or googleusercontent.com.
- Forward DNS lookup on that hostname. It must resolve back to the exact same IP you started with.
If either step fails, treat the request as unverified — regardless of what the user-agent string says. For bulk verification across large log files, cross-checking IPs against Google’s published crawler IP ranges (available as JSON) is faster than running DNS lookups on every line, and pre-filtering by Autonomous System Number (Google’s IP space) before running DNS checks cuts the workload further on high-traffic sites.
The same principle now applies well beyond Googlebot. AI crawlers have proliferated, and most major providers publish distinct user agents for training versus retrieval versus real-time, user-triggered fetches — a distinction that matters because blocking one doesn’t affect the others.
| Provider | Training crawler | Search / retrieval crawler | User-triggered fetch |
| — | Googlebot (also feeds AI Overviews / AI Mode) | — | |
| Google (AI training opt-out) | Google-Extended (token, not a separate crawler) | — | — |
| OpenAI | GPTBot | OAI-SearchBot | ChatGPT-User |
| Anthropic | ClaudeBot | Claude-SearchBot | Claude-User |
| Perplexity | — | PerplexityBot | Perplexity-User |
| Common Crawl | CCBot | — | — |
| Apple | Applebot-Extended | — | — |
A few things worth knowing about this table before you write any robots.txt rules from it:
- Blocking Google-Extended does not affect Google Search rankings or AI Overviews. It only opts your content out of future Gemini/Vertex AI training. Googlebot itself is what feeds Search and AI Overviews, and you cannot separate the two.
- Blocking a training crawler costs you nothing in citations; blocking a search or user-triggered crawler removes you from that engine’s AI answers entirely. These are different decisions and should be made separately, not with a single blanket Disallow: /.
- Compliance isn’t uniform. OpenAI, Anthropic, and Google publish documentation and generally honor robots.txt. Some other crawlers have documented histories of ignoring it. Robots.txt is a request, not an access control mechanism — for bots that don’t comply, server-level blocking is the only real lever.
- This list changes. New AI products ship new crawlers regularly, and names occasionally change. Treat your robots.txt AI-crawler section as something to re-verify quarterly against each provider’s current documentation, not a set-and-forget file.
The 8-Stage Log File Analysis Framework
Collecting logs is easy. Interpreting them into a prioritized action list is where most log analysis efforts stall — teams either drown in raw data or skim it for a single alarming number and stop. The MS Crawl Intelligence Framework™ structures the process into eight sequential stages, each with a specific output that feeds the next.
1. Collect. Pull raw access logs (and CDN/WAF logs separately, if applicable) covering at least 30 days — longer for enterprise sites, since crawl patterns on large sites take longer to stabilize. Include every subdomain and both HTTP and HTTPS variants if both are still reachable. Confirm the log format includes, at minimum: IP, timestamp, URL, status code, and user-agent.
2. Filter. Isolate crawler traffic from human traffic and background noise (health checks, internal monitoring, load balancer pings). At this stage you’re separating “everything” into “everything claiming to be a crawler,” which still includes fakes — that gets resolved next.
3. Classify. Run the verification method above to confirm which requests are genuine. Then segment verified crawler traffic by crawler identity (Googlebot Smartphone vs. Desktop, Bingbot, GPTBot, ClaudeBot, PerplexityBot, etc.), by URL template or directory, and by crawl purpose (first-time discovery vs. a refresh of a known URL).
4. Analyze. This is where the numbers start to mean something. Calculate: crawl frequency per URL template, the status-code distribution per template, response time correlated against crawl volume over time, and — the metric that matters most commercially — what percentage of total crawl requests are landing on URLs that generate no organic value (parameter duplicates, thin pagination, expired content, redirect targets).
5. Prioritize. Rank findings by business impact, not by volume of log lines. A redirect chain wasting 2% of crawl activity on your highest-converting service pages outranks a faceted-navigation issue wasting 20% of crawl activity on filter combinations nobody searches for.
6. Optimize. Implement the fixes: canonicalization, redirect cleanup, robots.txt adjustments, internal link pruning toward low-value URL patterns, XML sitemap accuracy corrections, and server-side response time improvements where slow templates are suppressing crawl rate.
7. Validate. Re-crawl the affected sections, confirm nothing was accidentally blocked, and check Search Console’s Coverage and Crawl Stats reports for the expected shift. Logs from the following two to four weeks are the real proof — dashboards update on their own schedule, but your logs show the change as it happens.
8. Monitor. Set a recurring review cadence tied to site change velocity — monthly for stable sites, weekly during and after a migration, redesign, or major content push. Log analysis that happens once and never again catches the current problem and misses the next one.
Reading Real Log Patterns: Four Scenarios You’ll See Repeatedly
The framework above is the method. These are the patterns it most commonly surfaces, illustrated with representative (not client-specific) log excerpts.
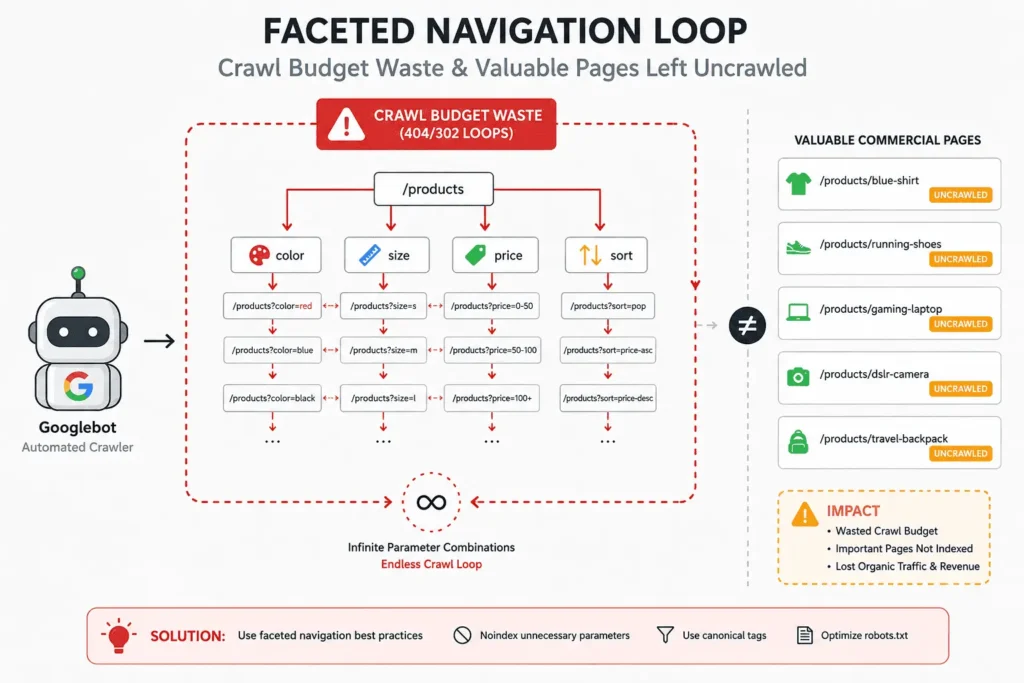
1. Crawl waste from faceted navigation. An e-commerce or directory-style site generates thousands of filter-combination URLs, and Googlebot dutifully requests all of them:
66.249.66.12 [03/Aug/2026:02:11:44] “GET /rooms/?sort=price&view=grid&guests=2 HTTP/1.1” 200 21044
66.249.66.14 [03/Aug/2026:02:11:51] “GET /rooms/?sort=price&view=list&guests=2 HTTP/1.1” 200 21038
66.249.66.9 [03/Aug/2026:02:12:03] “GET /rooms/?sort=rating&view=grid&guests=4 HTTP/1.1” 200 21051
Every one of these returns a 200 and near-identical content. In isolation, harmless. Multiplied across thousands of parameter combinations, it’s crawl capacity that never reaches your commercial pages. The fix belongs in canonicalization and parameter handling, which we cover in detail in our technical optimization guide.
2. Redirect chain waste. A URL migrated more than once, and nobody cleaned up the intermediate hops:
66.249.66.3 [03/Aug/2026:03:40:12] “GET /old-page/ HTTP/1.1” 301 178
66.249.66.3 [03/Aug/2026:03:40:12] “GET /interim-page/ HTTP/1.1” 301 178
66.249.66.3 [03/Aug/2026:03:40:13] “GET /current-page/ HTTP/1.1” 200 19822
Each hop is a separate crawl request. On a small site, negligible. On a site with hundreds of these chains left over from a redesign, it’s a measurable tax on crawl budget — and a common byproduct of the kind of platform migration covered in the Site Migration Guide.
3. Orphan pages Googlebot found before you told it to. A page exists, gets crawled, but appears nowhere in your XML sitemap and has no internal links pointing to it in your current site architecture:
66.249.66.21 [03/Aug/2026:05:02:09] “GET /blog/2024-seasonal-guide/ HTTP/1.1” 200 15230
Its presence in logs with no corresponding sitemap entry usually means Google found it through an external link or a stale internal reference that’s since been removed. This is exactly the kind of gap the XML Sitemap Guide addresses, and it’s a common source of “why is this old page still ranking when we don’t even link to it” confusion.
4. Slow response times suppressing crawl rate. A template with a heavy database query starts taking longer to respond, and crawl frequency on that template quietly drops over the following weeks:
66.249.66.5 [15/Jul/2026:09:00:02] “GET /industries/hospitality/ HTTP/1.1” 200 42011 0.312
66.249.66.5 [22/Jul/2026:09:00:02] “GET /industries/hospitality/ HTTP/1.1” 200 42011 0.890
66.249.66.5 [29/Jul/2026:09:00:04] “GET /industries/hospitality/ HTTP/1.1” 200 42011 1.740
This is the pattern log analysis catches earliest, because Search Console’s Crawl Stats report averages response time across the whole site and can mask a single degrading template for weeks. It’s also directly connected to Core Web Vitals — see the Core Web Vitals Guide for the front-end side of this same problem.
Log File Analysis vs. Google Search Console: What Each Source Actually Shows
According to recent industry reporting on AI crawler behavior, AI search bots require dedicated server log monitoring to prevent excessive crawl budget consumption and ensure proper content citation across generative engines.
| Server Log Analysis | Google Search Console (Crawl Stats) | |
| Scope | Every request that reached your server, from any crawler or bot | Google’s crawlers only |
| Sampling | Complete — no sampling | Google’s own aggregated summary |
| Non-Google crawlers | Fully visible (Bingbot, GPTBot, ClaudeBot, PerplexityBot, etc.) | Not covered |
| Granularity | Per-request, per-URL, per-second timestamps | Grouped by response, file type, purpose, and Googlebot type |
| Historical range | Limited by your log retention policy | 90 days, natively |
| Cost | Requires server/developer access; tooling cost varies | Free |
| Best for | Root-cause diagnosis, non-Google crawler visibility, exact timing of an issue | Fast health checks, trend confirmation, sanity-checking whether your log capture is complete |
That last row matters more than it looks: cross-referencing your own log-derived request counts against Search Console’s Crawl Stats totals for the same period is one of the more reliable ways to confirm you’re actually capturing all of Googlebot’s traffic and not missing a CDN-cached layer.
One 2026 development worth building into your workflow: Search Console now reports AI Overview and AI Mode impressions natively, at no cost. This doesn’t replace log-based crawler verification — it still won’t tell you whether GPTBot or ClaudeBot visited a given page — but it removes the need to build custom tracking infrastructure just to see Google’s own AI-surface impressions, which was a common (and now unnecessary) engineering project as recently as early 2026.
How This Connects to Crawl Budget (and where the two topics split)
Log file analysis is the instrument. Crawl budget optimization is the strategy the instrument informs. They’re related but not interchangeable, and this article deliberately stays on the diagnostic side of that line — the full optimization playbook lives in the Crawl Budget Guide.
Two 2026 developments are worth knowing regardless of which guide you’re reading:
- In July 2026, Google rewrote its large-site crawl budget documentation to clarify that every site now starts with the same conservative default crawl-capacity limit, which Google’s systems raise automatically only when crawl demand increases and the server continues responding quickly and reliably. In practice, this makes server response time even more directly tied to how much of your site gets crawled — the third log scenario above (redirect waste) and fourth (response-time degradation) are exactly the patterns this update makes more consequential, not less.
- Crawl capacity is increasingly shared across Googlebot and the growing volume of AI training and research crawlers hitting the same infrastructure. On sites with heavy AI-bot traffic, that competition for server capacity can measurably suppress the effective rate at which Googlebot itself can crawl — another reason the crawler-classification step in the framework above isn’t optional busywork.
Crawl budget only becomes a real lever on sites above roughly 10,000 URLs, or smaller sites with faceted navigation, pagination, or parameter-heavy architectures generating URL volume well beyond their actual page count. Below that threshold, the log analysis in this guide is still worth doing for the indexation and technical-health signal it provides — you’re just less likely to be capacity-constrained.
How Log File Analysis Relates to the Rest of Technical SEO
Log file analysis doesn’t operate in isolation — it’s the diagnostic layer underneath several other technical SEO disciplines, and understanding the relationships helps clarify what belongs in this guide versus its neighbors.
- Crawlability is the outcome log analysis measures directly: whether crawlers can reach and request a URL at all. A page can be perfectly optimized and still be effectively invisible if logs show it’s rarely or never requested.
- Indexation is one step downstream of crawlability. Logs show you that a page was crawled; Search Console’s Coverage report tells you whether that crawl resulted in indexing. Reading the two together is how you distinguish “Google hasn’t found this yet” from “Google found it and chose not to index it” — two problems with completely different fixes.
- HTTP status codes are the raw signal log analysis is built on. A site returning too many 4xx or 5xx responses to crawlers is actively teaching search engines that its inventory is unreliable, which suppresses future crawl demand.
- Server response time is the performance variable most directly tied to crawl rate. Slow, inconsistent responses are one of the few things that cause Google to voluntarily reduce how much of a site it requests, independent of how valuable the content is.
- XML sitemaps and robots.txt are the two files logs are most useful for auditing against: sitemaps tell crawlers where you want them to go, robots.txt tells them where you don’t, and logs tell you what they actually did with both instructions.
- Crawl budget is the strategic layer these signals feed into — the question of how to allocate limited crawl capacity once log analysis has told you where it’s currently being spent.
None of these topics compete with this article for the same search intent; each owns a distinct piece of the same underlying system, which is exactly why they’re linked throughout this guide rather than re-explained here.
Tools for Log File Analysis in 2026
You don’t need enterprise software to start. You need the right tool for your site’s scale.
| Tool | Best for | Note |
| Google Search Console (Crawl Stats) | Every site, as a starting point | Free, but Google-only and pre-aggregated |
| Screaming Frog Log File Analyser | Small to mid-size sites, desktop analysis, first-time audits | Low cost, no data leaves your machine, handles most sites well under six figures of URLs |
| JetOctopus | Growing sites/agencies needing cloud processing without full enterprise pricing | Cloud-based, pairs crawl data with log data |
| OnCrawl / Lumar | Sites where log-driven crawl budget analysis is the primary need | Strong segmentation and big-data log handling |
| Botify | True enterprise scale (millions of URLs, multiple stakeholder teams) | Full-funnel platform combining crawl, log, and performance data; quote-gated pricing |
| DIY (ELK Stack / Splunk) | Technical teams with existing log infrastructure and engineering time to build it | Maximum flexibility, meaningful setup cost |
A practical sequencing note: start with Search Console plus a desktop tool like Screaming Frog’s Log File Analyser. Move to a cloud platform only when you’re consistently running analysis past roughly 100,000–1,000,000 URLs, or when the business case for continuous monitoring (rather than periodic audits) is already proven. Buying enterprise log tooling before you’ve run a manual process successfully a few times tends to produce expensive infrastructure for a workflow nobody has validated yet.
A Step-by-Step Workflow for Your First Log File Analysis
- Request the logs. Specify the date range (30 days minimum), format, and which layer (origin server vs. CDN) you need. Confirm retention policy so you’re not repeating this request in two weeks.
- Verify crawler identity. Run reverse + forward DNS checks on a sample, or match IPs against published crawler ranges, before trusting any user-agent field.
- Segment by URL template. Group requests by page type (service pages, blog, glossary, parameter URLs, etc.) rather than analyzing the site as one undifferentiated list.
- Cross-reference against your sitemap and internal link structure. Flag anything crawled that isn’t in your sitemap (orphan pages) and anything in your sitemap that logs show is rarely or never crawled.
- Quantify crawl waste. Calculate the percentage of total crawl requests landing on non-indexable, duplicate, or redirect-target URLs.
- Correlate response time with crawl frequency. Identify any templates where slowing response times track against declining crawl volume.
- Prioritize fixes by commercial impact, not by which issue has the most log lines attached to it.
- Re-measure after implementation. Pull a fresh log window two to four weeks post-fix and confirm the shift actually happened.
Common Mistakes in Log File Analysis
- Trusting the user-agent string without DNS verification. This single mistake can inflate or deflate every downstream number.
- Analyzing too short a window. A 3–7 day sample doesn’t capture weekly crawl rhythms, let alons monthly ones, on anything but the highest-traffic sites.
- Ignoring non-Google crawlers entirely. If AI visibility is a business goal, GPTBot, ClaudeBot, and PerplexityBot activity (or absence) is directly relevant data sitting in the same log file.
- Treating the whole site as one dataset. Aggregate crawl stats hide template-level problems the way an average always hides its outliers.
- Running the analysis once and calling it done. Crawl behavior shifts with every migration, redesign, and content push; a single audit answers a single moment in time.
- Drawing conclusions from incomplete retention. If logs only cover 10 of the last 30 days because of rotation settings, say so explicitly rather than presenting a partial sample as a full picture.
- Confusing CDN cache logs with origin server logs. If a page is served from cache, the origin server never sees that request — analyzing CDN logs and origin logs as though they’re the same dataset produces contradictory crawl counts.
- Skipping the business-impact step. A perfectly accurate list of crawl anomalies that never gets ranked by revenue or authority impact tends to sit unread; prioritization is what turns the analysis into something a client or stakeholder will actually act on.
Best Practices
- Extend log retention to at least 60–90 days before you need historical trend data, not after.
- Automate crawler verification for high-traffic sites rather than spot-checking manually every time.
- Segment findings by URL template and tie each finding to a specific, named fix — a list of anomalies isn’t an action plan.
- Re-run the analysis on a fixed cadence, and treat Search Console’s Crawl Stats as a cross-check against your own log capture, not a replacement for it.
- Make robots.txt decisions about AI crawlers deliberately, per crawler category (training vs. search vs. user-triggered), and revisit the file quarterly as the AI crawler landscape keeps shifting.
- Loop in whoever manages hosting or infrastructure early. Log access, retention settings, and CDN configuration are usually outside a marketer’s direct control, and this is the most common source of delay in an otherwise fast audit.
- Keep a written log of what changed and when (deploys, migrations, robots.txt edits). Without that timeline, a crawl-pattern shift in the data is much harder to explain with confidence.
FAQ
What is log file analysis in SEO, and how does it improve crawl budget and indexing in 2026? Log file analysis is the process of examining a website’s server logs to see exactly how crawlers like Googlebot access and interact with pages. By analyzing crawl frequency, status codes, and response times, SEO teams can identify crawl waste and indexing issues that don’t show up in Search Console or GA4 alone, and use that data to prioritize technical fixes.
How is log file analysis different from Google Search Console data? Search Console’s Crawl Stats report shows Google’s own aggregated summary of Googlebot activity only. Server logs record every request from every crawler, unsampled, at the individual URL level — including Bingbot and AI crawlers Search Console doesn’t report on at all.
How often should log file analysis be performed? Monthly for stable sites is a reasonable baseline. Increase to weekly during and immediately after a migration, redesign, or major content push, when crawl behavior is most likely to shift.
Can log file analysis help with AI search visibility (GEO/AEO)? Yes. Server logs are the only place you can directly confirm whether GPTBot, ClaudeBot, PerplexityBot, or similar crawlers are actually requesting your pages — a prerequisite for AI citation that neither Search Console nor GA4 can show you.
Do I need an enterprise tool to start doing log file analysis? No. Search Console plus a desktop tool like Screaming Frog’s Log File Analyser covers most small-to-mid-size sites. Enterprise platforms earn their cost past roughly 100,000–1,000,000 URLs or when continuous monitoring, not periodic audits, is the actual requirement.
How do I know if a “Googlebot” visit in my logs is real? Run a reverse DNS lookup on the IP and confirm the hostname ends in googlebot.com, google.com, or googleusercontent.com, then run a forward DNS lookup on that hostname and confirm it resolves back to the original IP. If either step fails, it isn’t verified as Googlebot, regardless of the user-agent header.
Next Step
Log file analysis tells you what’s actually happening. What you do with that information is where the value gets realized — and that’s implementation work best scoped against your specific architecture, crawl history, and business priorities, not a generic checklist.
If you want a structured starting point before that conversation, the Scrapper Growth Engine™ Log File Analysis Checklist walks through the collection, verification, and triage steps in this guide as a standalone reference: [Download the Log File Analysis Checklist].
If you’re ready to see what your own logs are actually saying: [Book a Technical SEO Audit] — the audit runs the MS Crawl Intelligence Framework™ against your site directly, on your own data.